STATISTICAL ANALYSIS IN COMPUTATIONAL MODELING OPTIMIZATION
This project is an undergraduate research project aimed at building a computational model using various parameters, and statistically analyzing the model to quantify the effect of a particular parameter in creating a homogenized model.
OBJECTIVE
In this project, a novel approach to analyzing and optimizing the performance of a computational modeling using a statistical analysis called Monte Carlo Method will be presented. Due to the stochastic nature of the modeling process, using a statistical method is an appropriate way to measure the degree of randomness present in the model generation phase. The next section provides a brief background and motivation for the research, followed by sections which discuss how the computational model was generated and how its performance was analyzed using statistical analysis.
BACKGROUND
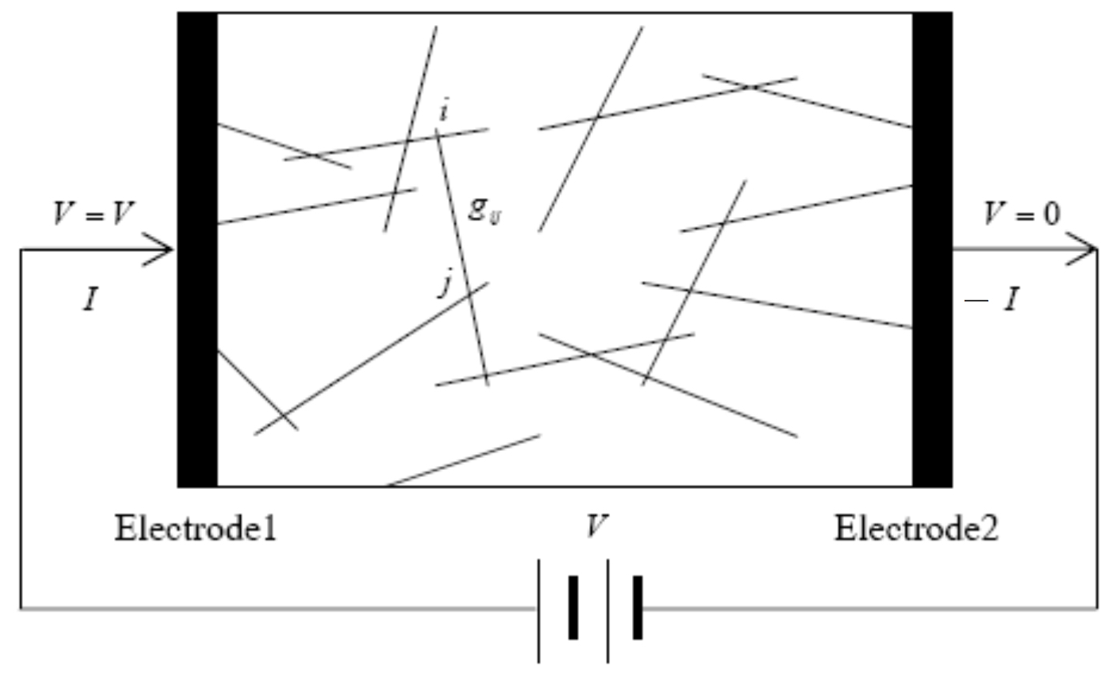
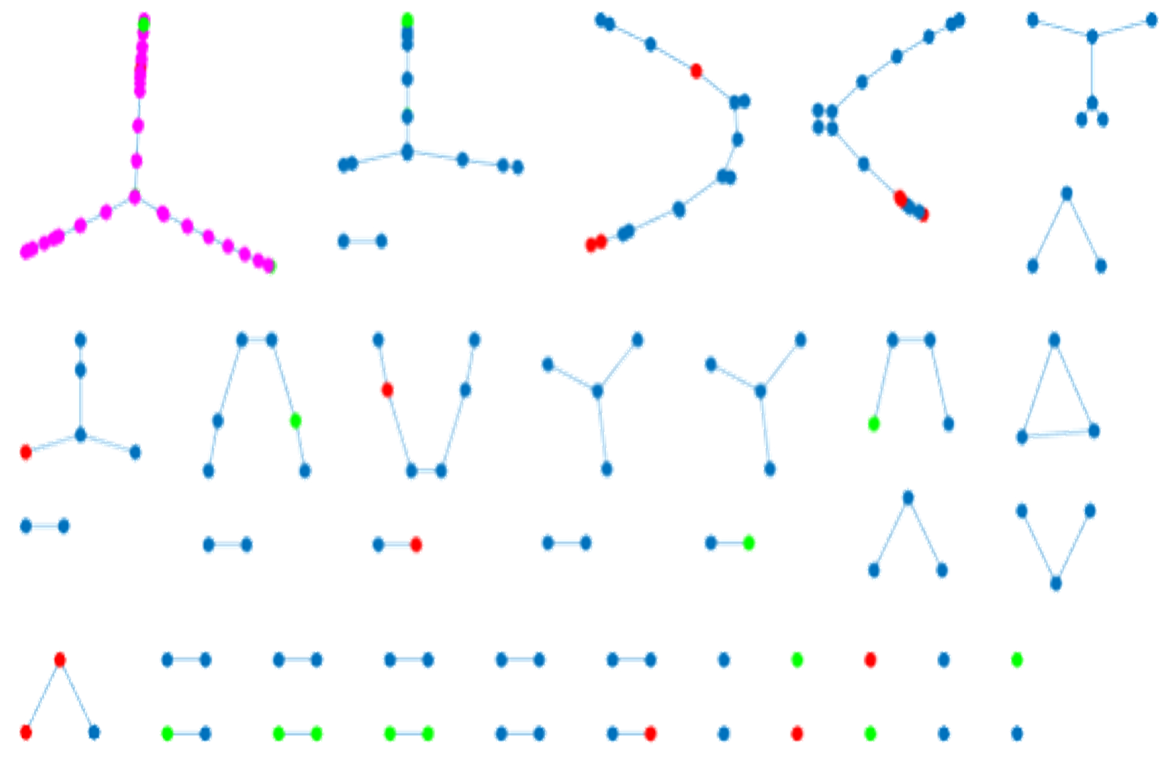
Carbon nanotubes, or CNTs are tubes made of carbon with diameters measured in nanometers. Due to their exceptional electrical conductivity, tensile strength, and thermal conductivity, CNTs are used as filler in polymer composites in order to produce a hybrid material that exhibits a unique material property. For instance, when CNTs are mixed with resin, a low conductivity material, current can flow through the network of connected CNTs, significantly increasing the polymer conductivity. It can be seen from the Figure below that the CNT network acts as an electric circuit with resistors.
Network of Connected CNTs
Percolation threshold
Due to this unique material property, there is a non-linear relationship between the total volume of the CNTs with respect to the base material (or filler volume fraction) and the electrical conductivity. As more CNTs are added to the base material, there is a point where enough CNTs are connected so that current flows from one end to the other end through the network of connected CNTs. This point is called the Percolation Threshold, where the electrical conductivity rises substantially, as shown in Figure below:
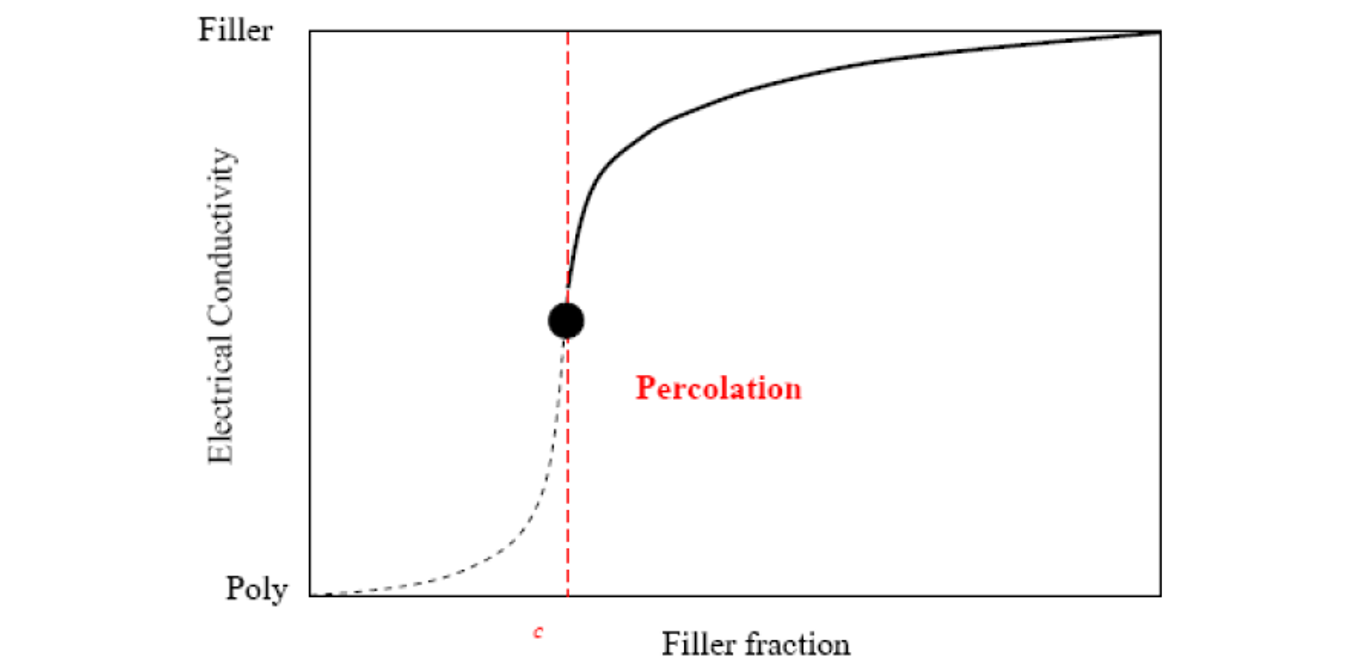
polymer reaches a certain threshold, conductivity spikes
To perform various what-if analysis with the CNT-embedded polymers, building a computational model that can quantify the effects of various process parameters on the desired properties of CNT polymer composites would provide an efficient and economical means to assessing the material properties of the polymer.
MODEL GENERATION
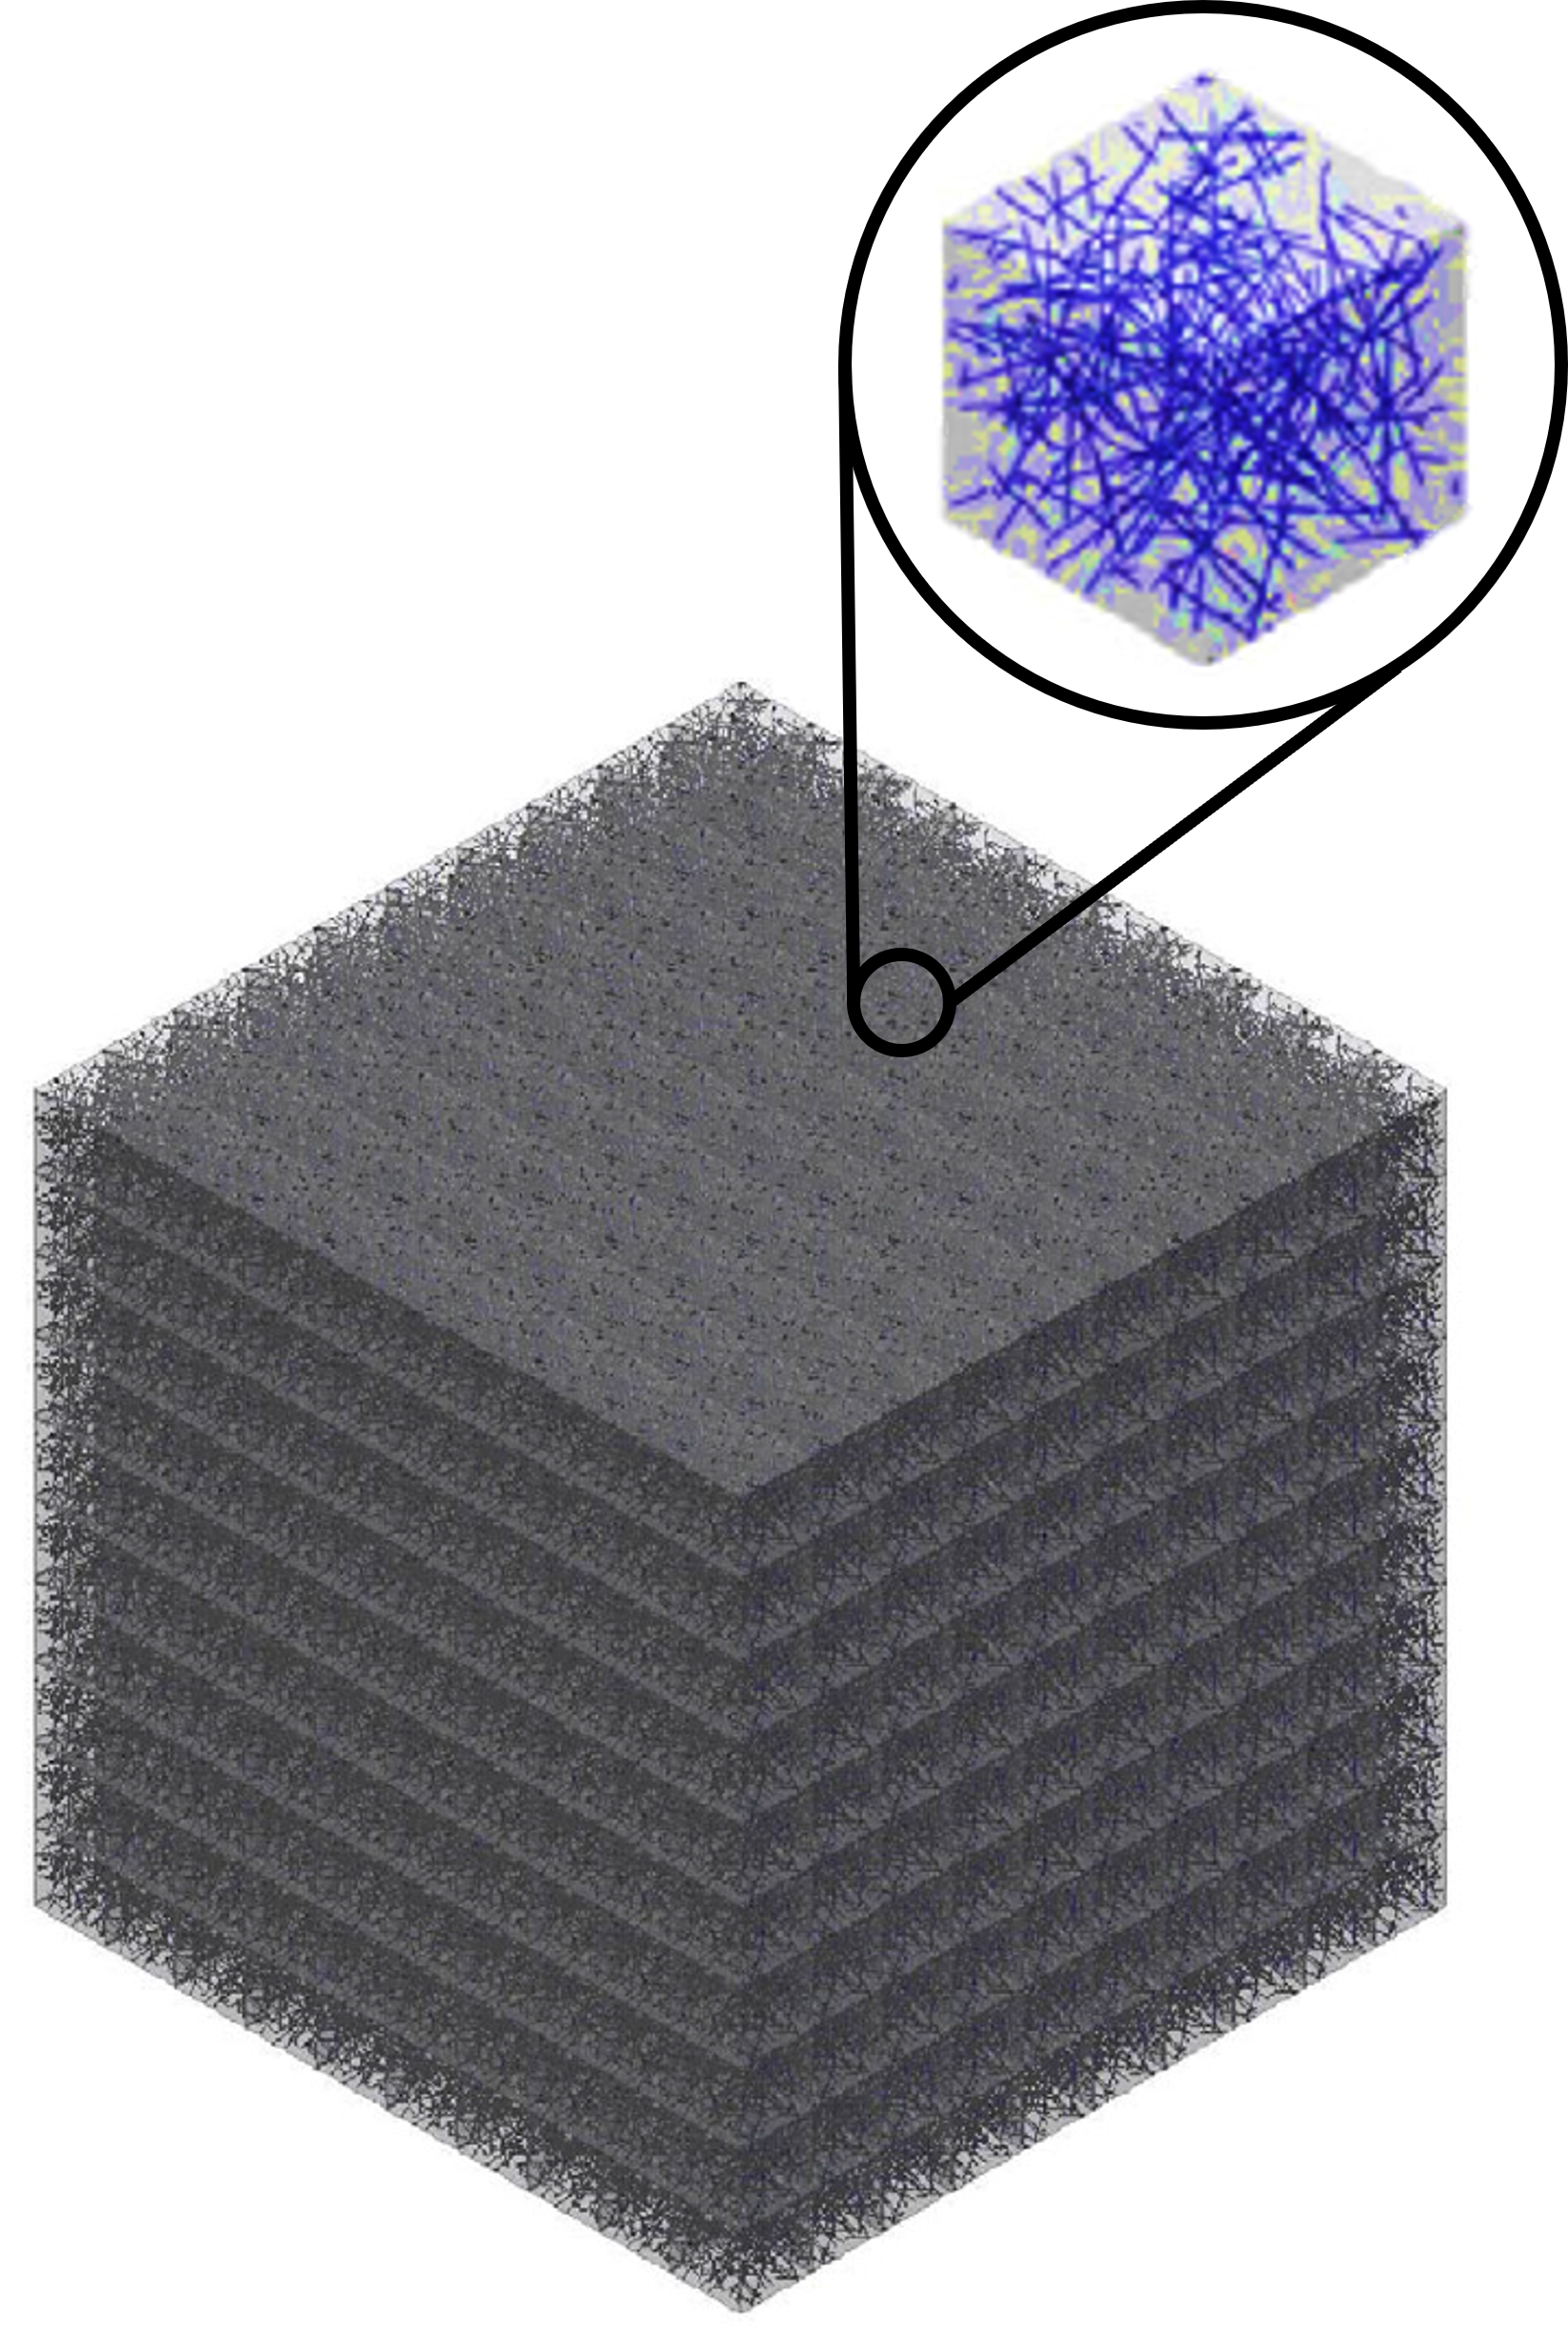
To generate a model, we first define a representative volume element, or RVE, the smallest volume over which a measurement can be made that yields a property value representative of the whole. In continuum mechanics for a heterogeneous material, RVE can be considered as a volume that represents a composite statistically, which is small enough to be considered for macroscopic property representation and sufficiently large to ensure the independence of boundary conditions. In these models the choice of statistical RVE is usually not unique, but it should be large enough to represent the filler morphology and spatial distribution and as small as possible to reduce the computation cost. The network of CNTs can then be added to the RVE to compute the conductivity.
CONTACT ALGORITHM
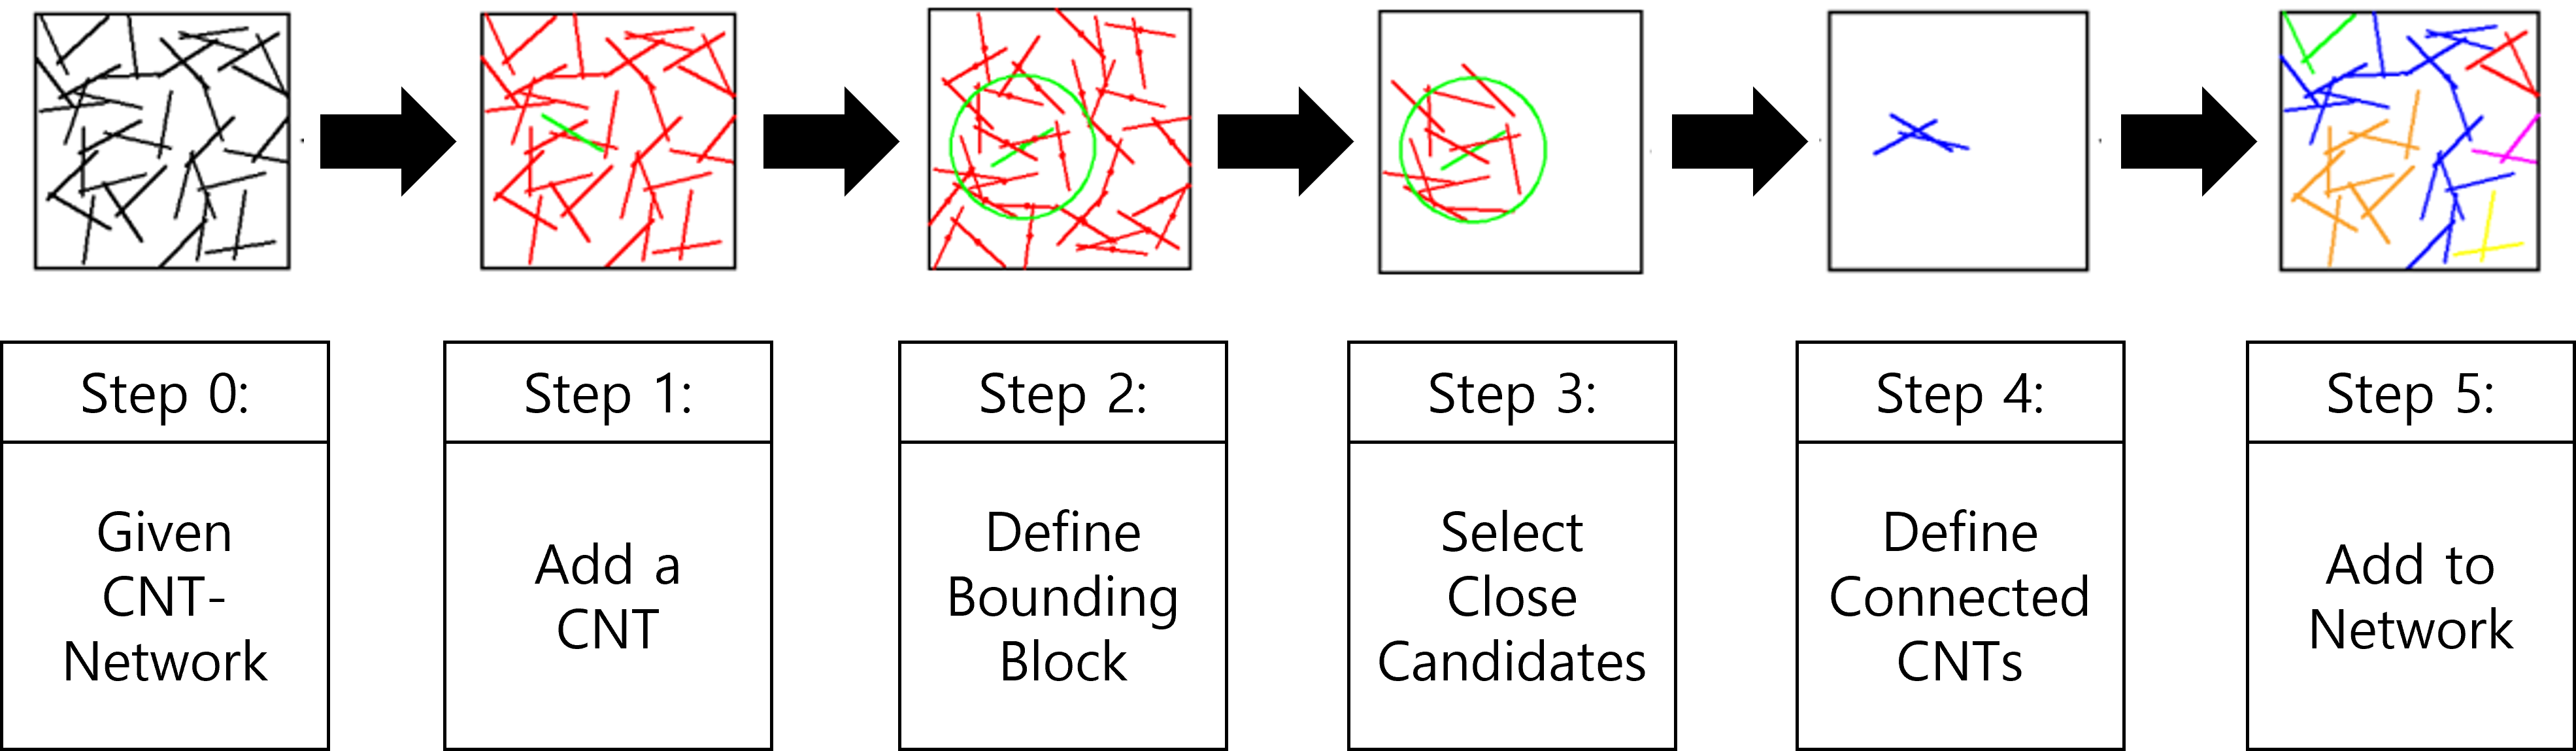
When CNTs are added one by one to the RVE, they form a connection when the distance between the added CNT and any of the existing CNTs already in the network is close enough. The minimum distance between one CNT and the other CNT must be less than a set tolerance (Ɛ). Since the probability that randomly created CNTs are exactly in contact with the modeling is very small, it is considered that two CNTs are in contact if they are smaller than a certain tolerance. Every time a new CNT is created, finding a network is computationally inefficient, so a model that creates a bounding block that selects a few candidates that are nearby the added CNT is developed. This method allows the contact algorithm to make an efficient search.
GRAPH-BASED NETWORK
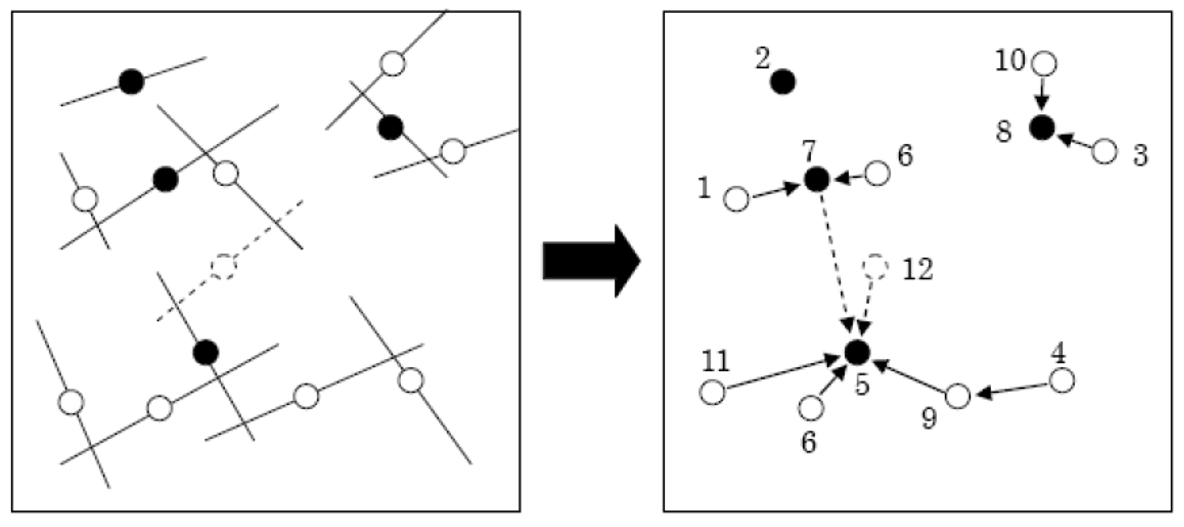
As we fill in CNTs inside the box, the added CNT may be connected to more than one existing CNT. In order to keep track of the network of connections, we assign a unique id to each CNT and save the connections in graph structure as shown below.
Since each CNT is connected to a different CNT and the connection point has a resistor-resistor relationship, which is used to calculate the conductivity, it is important to manage the connection type over the network and calculate the conductivity through it. The percolation threshold algorithm is used to track the CNTs, whose center-to-center distance is equal to the diameter of the CNT. To do this we used a breadth-first search algorithm to efficiently search through the network of CNTs to find the path from one end to the opposite end.
Graph-based Network Analysis
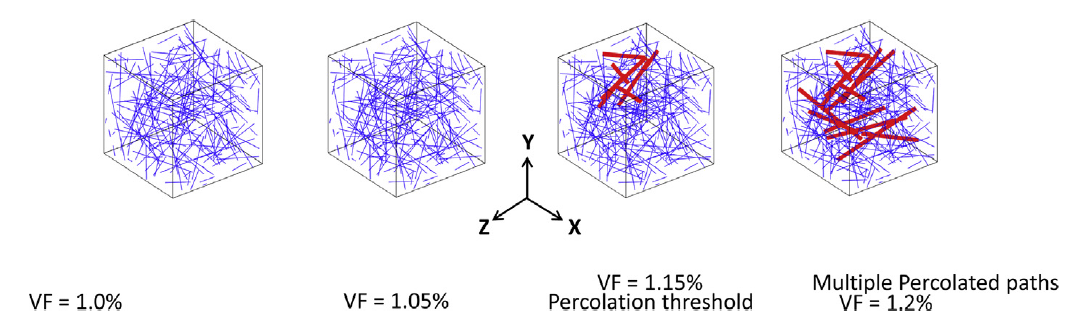
When enough CNTs are made such that the connection starts at one side of the bounding box to the other side, it is when the percolation threshold is reached. Percolation in X direction is defined when a conductivity path is achieved from one end to the other in the desired direction. The volume fraction at which percolation happens is defined as the percolation threshold. As we increase the number of CNTs after the percolation threshold, multiple paths could occur, as shown in the figure below.
STATISTICAL ANALYSIS
Every time a model is generated, a different network composition is formed, resulting in a different material property. To ensure robustness to randomness in model generation, we used monte carlo method to analyze the effects of random variables to the modeling property and apply a setting that minimizes the variance in the simulated material property.
MONTE CARLO METHOD
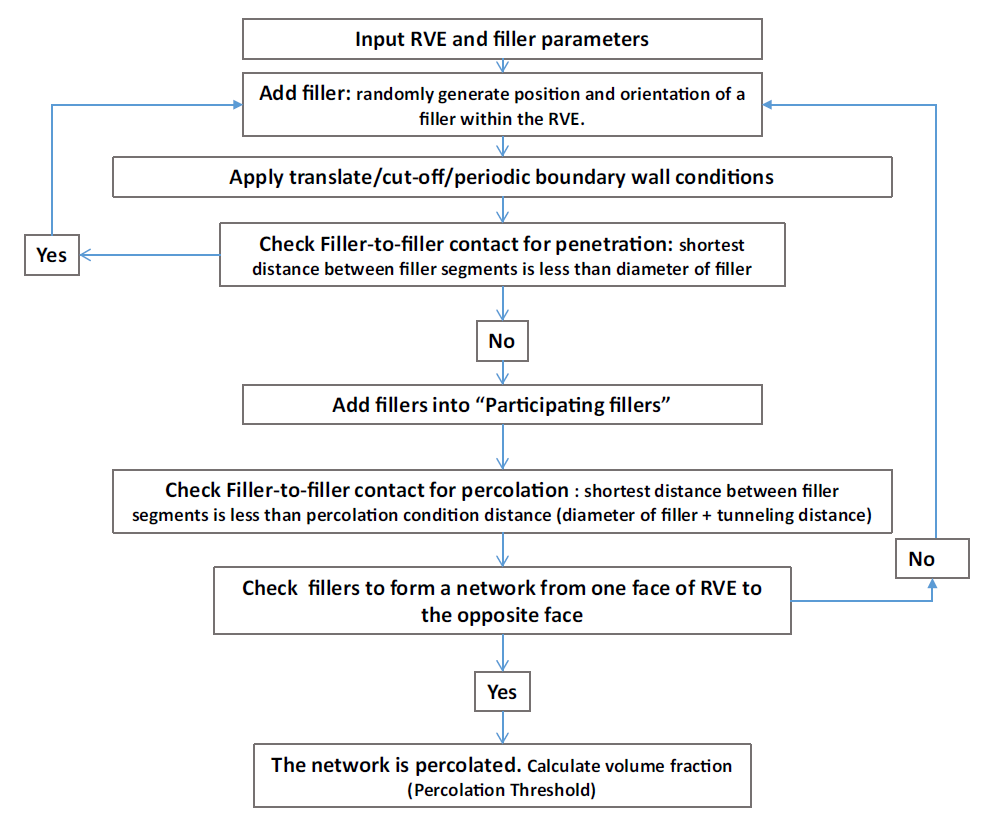
A monte carlo simulation is used to model the probability of different outcomes in a process that cannot easily be predicted due to the intervention of random variables. By generating the model a number of times and recording the percolation threshold, we can see how much the results vary. By adjusting several factors that act as random variables in the model generation, we can minimize the variance, making the model more reliable and homogenized. The overall model generation follows the following flowchart.
There are two approaches to making a homogenized model. We can perform Monte Carlo Simulation to both approaches to analyze and compare the effects of both factors.
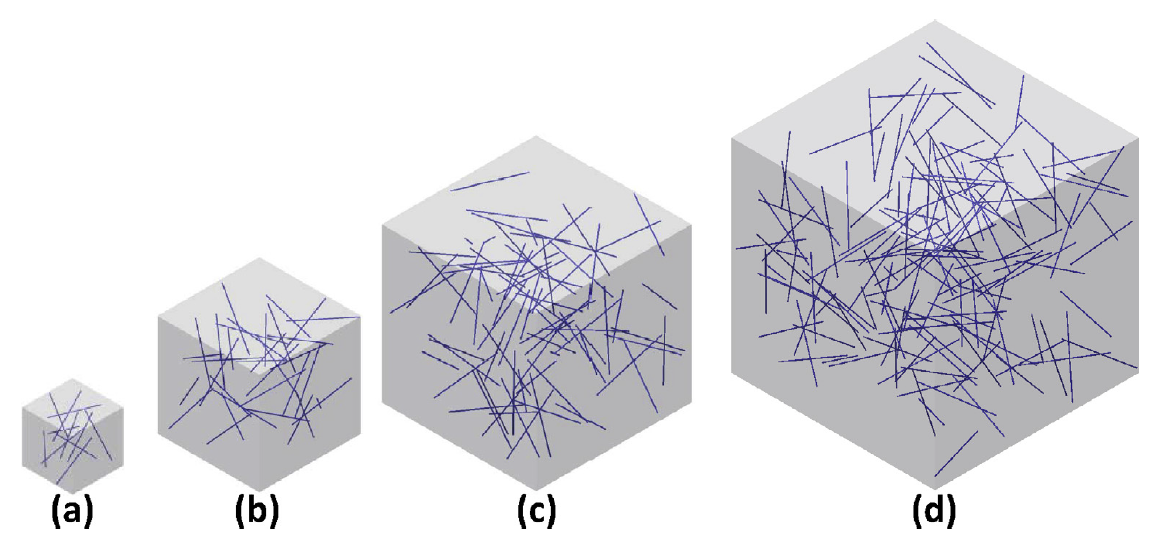
First Approach: Varying Sizes of RVE
Simulations with increasing RVE size are performed to analyze the effect of RVE size in the standard deviation of the percolation threshold values. A number of simulation is performed to predict the critical RVE size.
Second Approach: Periodic Boundary Conditions
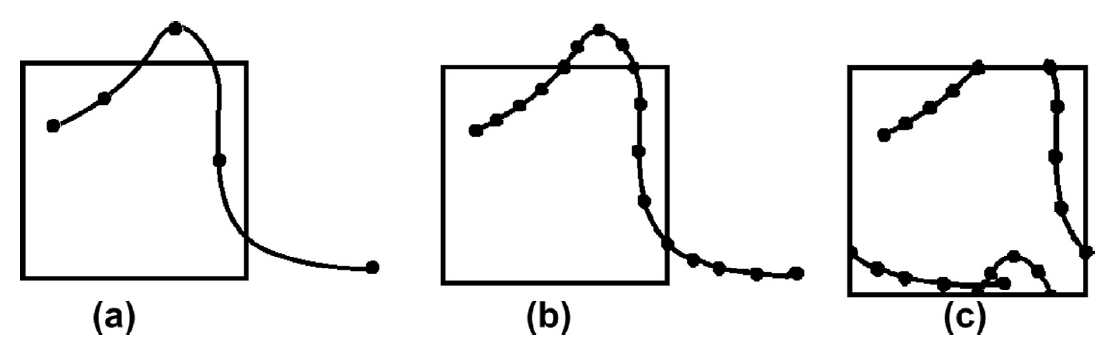
Determining a critical size of such statistical RVE, which can predict a homogenized property of interest, is computationally very expensive. Computational homogenization with material periodic boundary conditions is one alternative to reduce the computational complexity. Periodic boundary conditions involve placing fillers that exceed the RVE into their respective position on the opposite face of RVE as if the RVE is part of a larger network of RVEs.
RESULT
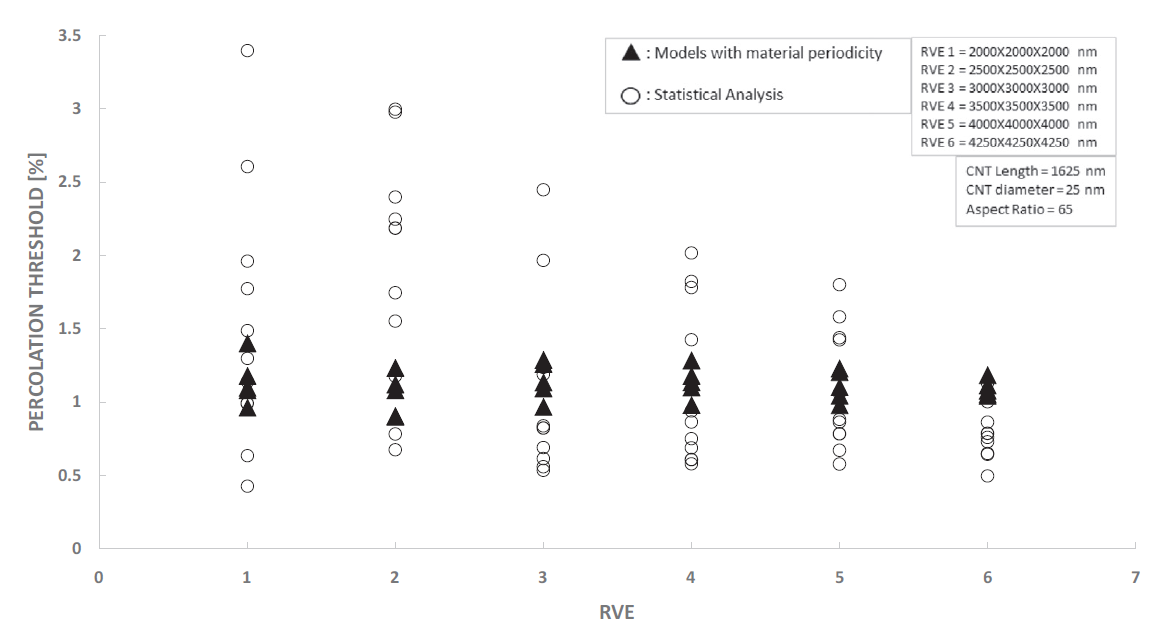
Because of the repeated random sampling of fillers within RVE used in the percolation analysis, the percolation threshold obtained varies when the analysis is repeated for the same RVE size as shown in the demonstrations below.
Percolation analysis for each RVE size is conducted for ten realizations and the percolation threshold values are plotted for each RVE size as shown in figure below, represented by unfilled circles. When the cubic RVE size is increased, the statistical variation in the predicted percolation threshold values (unfilled circles) is reduced. For a critical cubic RVE size of 4250 nm the standard deviation of percolation threshold values for ten realizations is less than 0.1, which is considered as a homogenized result. It could be seen that the percolation threshold was reached at different volume fractions. It was found that models with material periodicity had less variance.
Simulations with increasing RVE size are performed until the standard deviation of computed apparent property for each RVE size is minimum (<0.1) to predict the critical RVE size. The percolation analysis using statistical models with translation boundary conditions indicates that the predicted percolation threshold values are dependent on RVE size. The percolation threshold values predicted exhibit statistical variation and are more scattered when the analysis is repeated for the same RVE size. For larger RVE sizes, the scatter in the predicted percolation threshold gradually reduces leading to more homogenized results. Statistical analysis models with Shifting boundary conditions are computationally expensive, requiring many realizations of large random media to predict homogenized results.
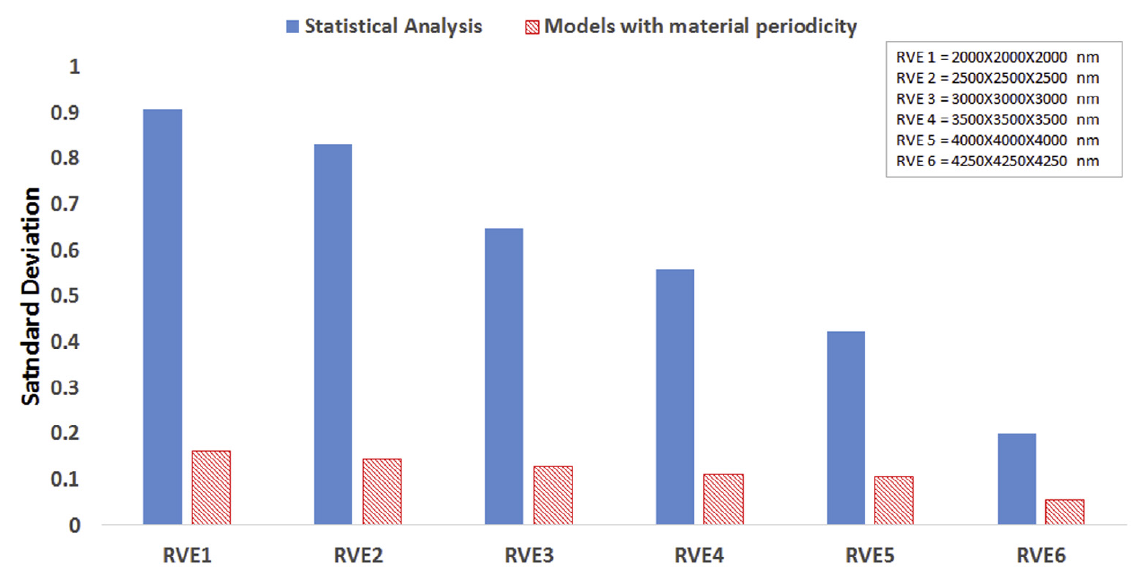
It was demonstrated that computational homogenized models with material periodic conditions are independent of RVE size and provide homogenized results and are computationally efficient compared to statistical models.
The standard deviation of percolation threshold values for various realizations using models with material periodic conditions is consistently low for all RVE sizes studied. The standard deviation of percolation threshold values with statistical analysis on the other hand is very high for smaller RVE size and gradually reduces towards a homogenized solution for a large critical RVE size. The 3D RVE models with material periodicity presented in this work are attractive for homogeneous mechanical and electrical property estimation of CNT–polymer composite structures.
MODEL VERIFICATION
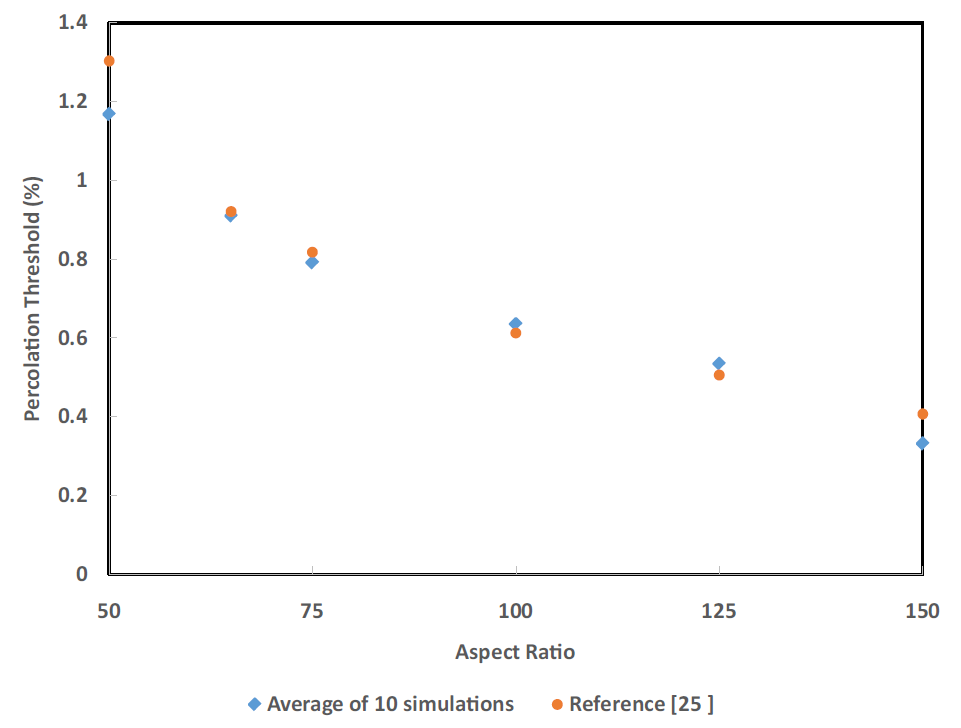
For a critical cubic RVE size of 4250 nm, the standard deviation of percolation threshold values for ten realizations is less than 0.1, which is considered a homogenized result. After an appropriate RVE size is determined, we can tune other parameters, such as orientation, aspect ratio, and distance threshold of CNTs to adjust our results to the experimental values reported in the literature. For the literature, we referred to this article. Figure below shows the comparison of percolation threshold values for various CNT aspect ratios. Predicted critical RVE size of 4250 nm with varying aspect ratio of CNT is used for this purpose. We can use the reported literature values to calibrate our results. The percolation threshold values averaged over ten simulations match very well with the values reported in the literature.
FUTURE RELATED WORKS
The property of interest may include mechanical properties such as elastic moduli, percolation threshold, electrical and thermal properties, and other averaged quantities that are used to describe physical systems.
AWARDS (FROM GEORGIA TECH)
- Outstanding Undergraduate Research Award in ME Department in annual Undergraduate Research Opportunities Symposium (UROP), Spring 2016
- 2nd place oral presentation award in all engineering departments in annual UROP Symposium, Spring 2015
- President's Undergraduate Research Award ($1,500), Spring 2016
- President's Undergraduate Research Award ($1,500), Summer 2016
- Air Products Undergraduate Research Award ($1,500), Spring 2015