DATA-DRIVEN APPROACH TO HIGH-LEVEL ROBOT CONTROL
This project is part of the "ME 310A: Global Engineering Design Thinking, Innovation, and Entrepreneurship" course in Stanford University, aimed at ideating on innovative ways to design products that best address the needs of stakeholders.
Objective
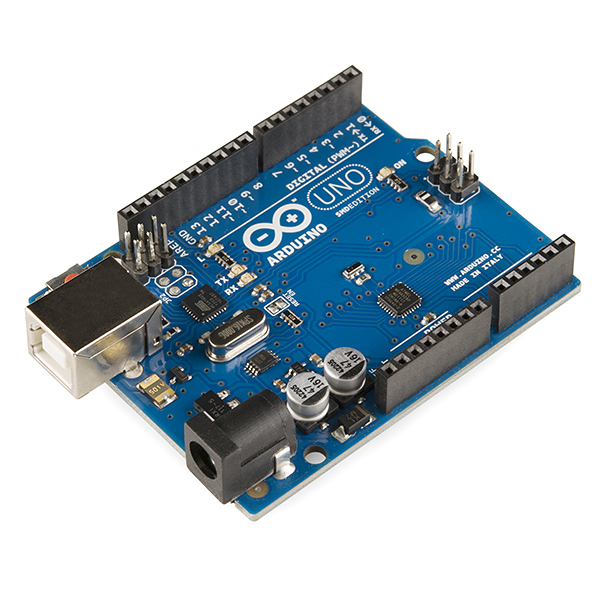
We can build a robot using an Arduino, an open hardware development board that can be used to design and build devices that interact with the real world. When motors are connected to this microcontroller, we can program it to make real time control decisions. The problem with working with an Arduino is that it can only understand simple commands, such as: move motor A and B for 3 seconds at a speed of 2000 rpm. To make high-level controls to a two-wheeled robot with these simple commands, we would have to know how the robot behaves when different sets of control inputs are given. By analyzing the data of the behavior of the robot, we can gain a deep understanding of the way the robot behaves in the real world and therefore make a sound decision in controlling the robot.
Problem Formulation
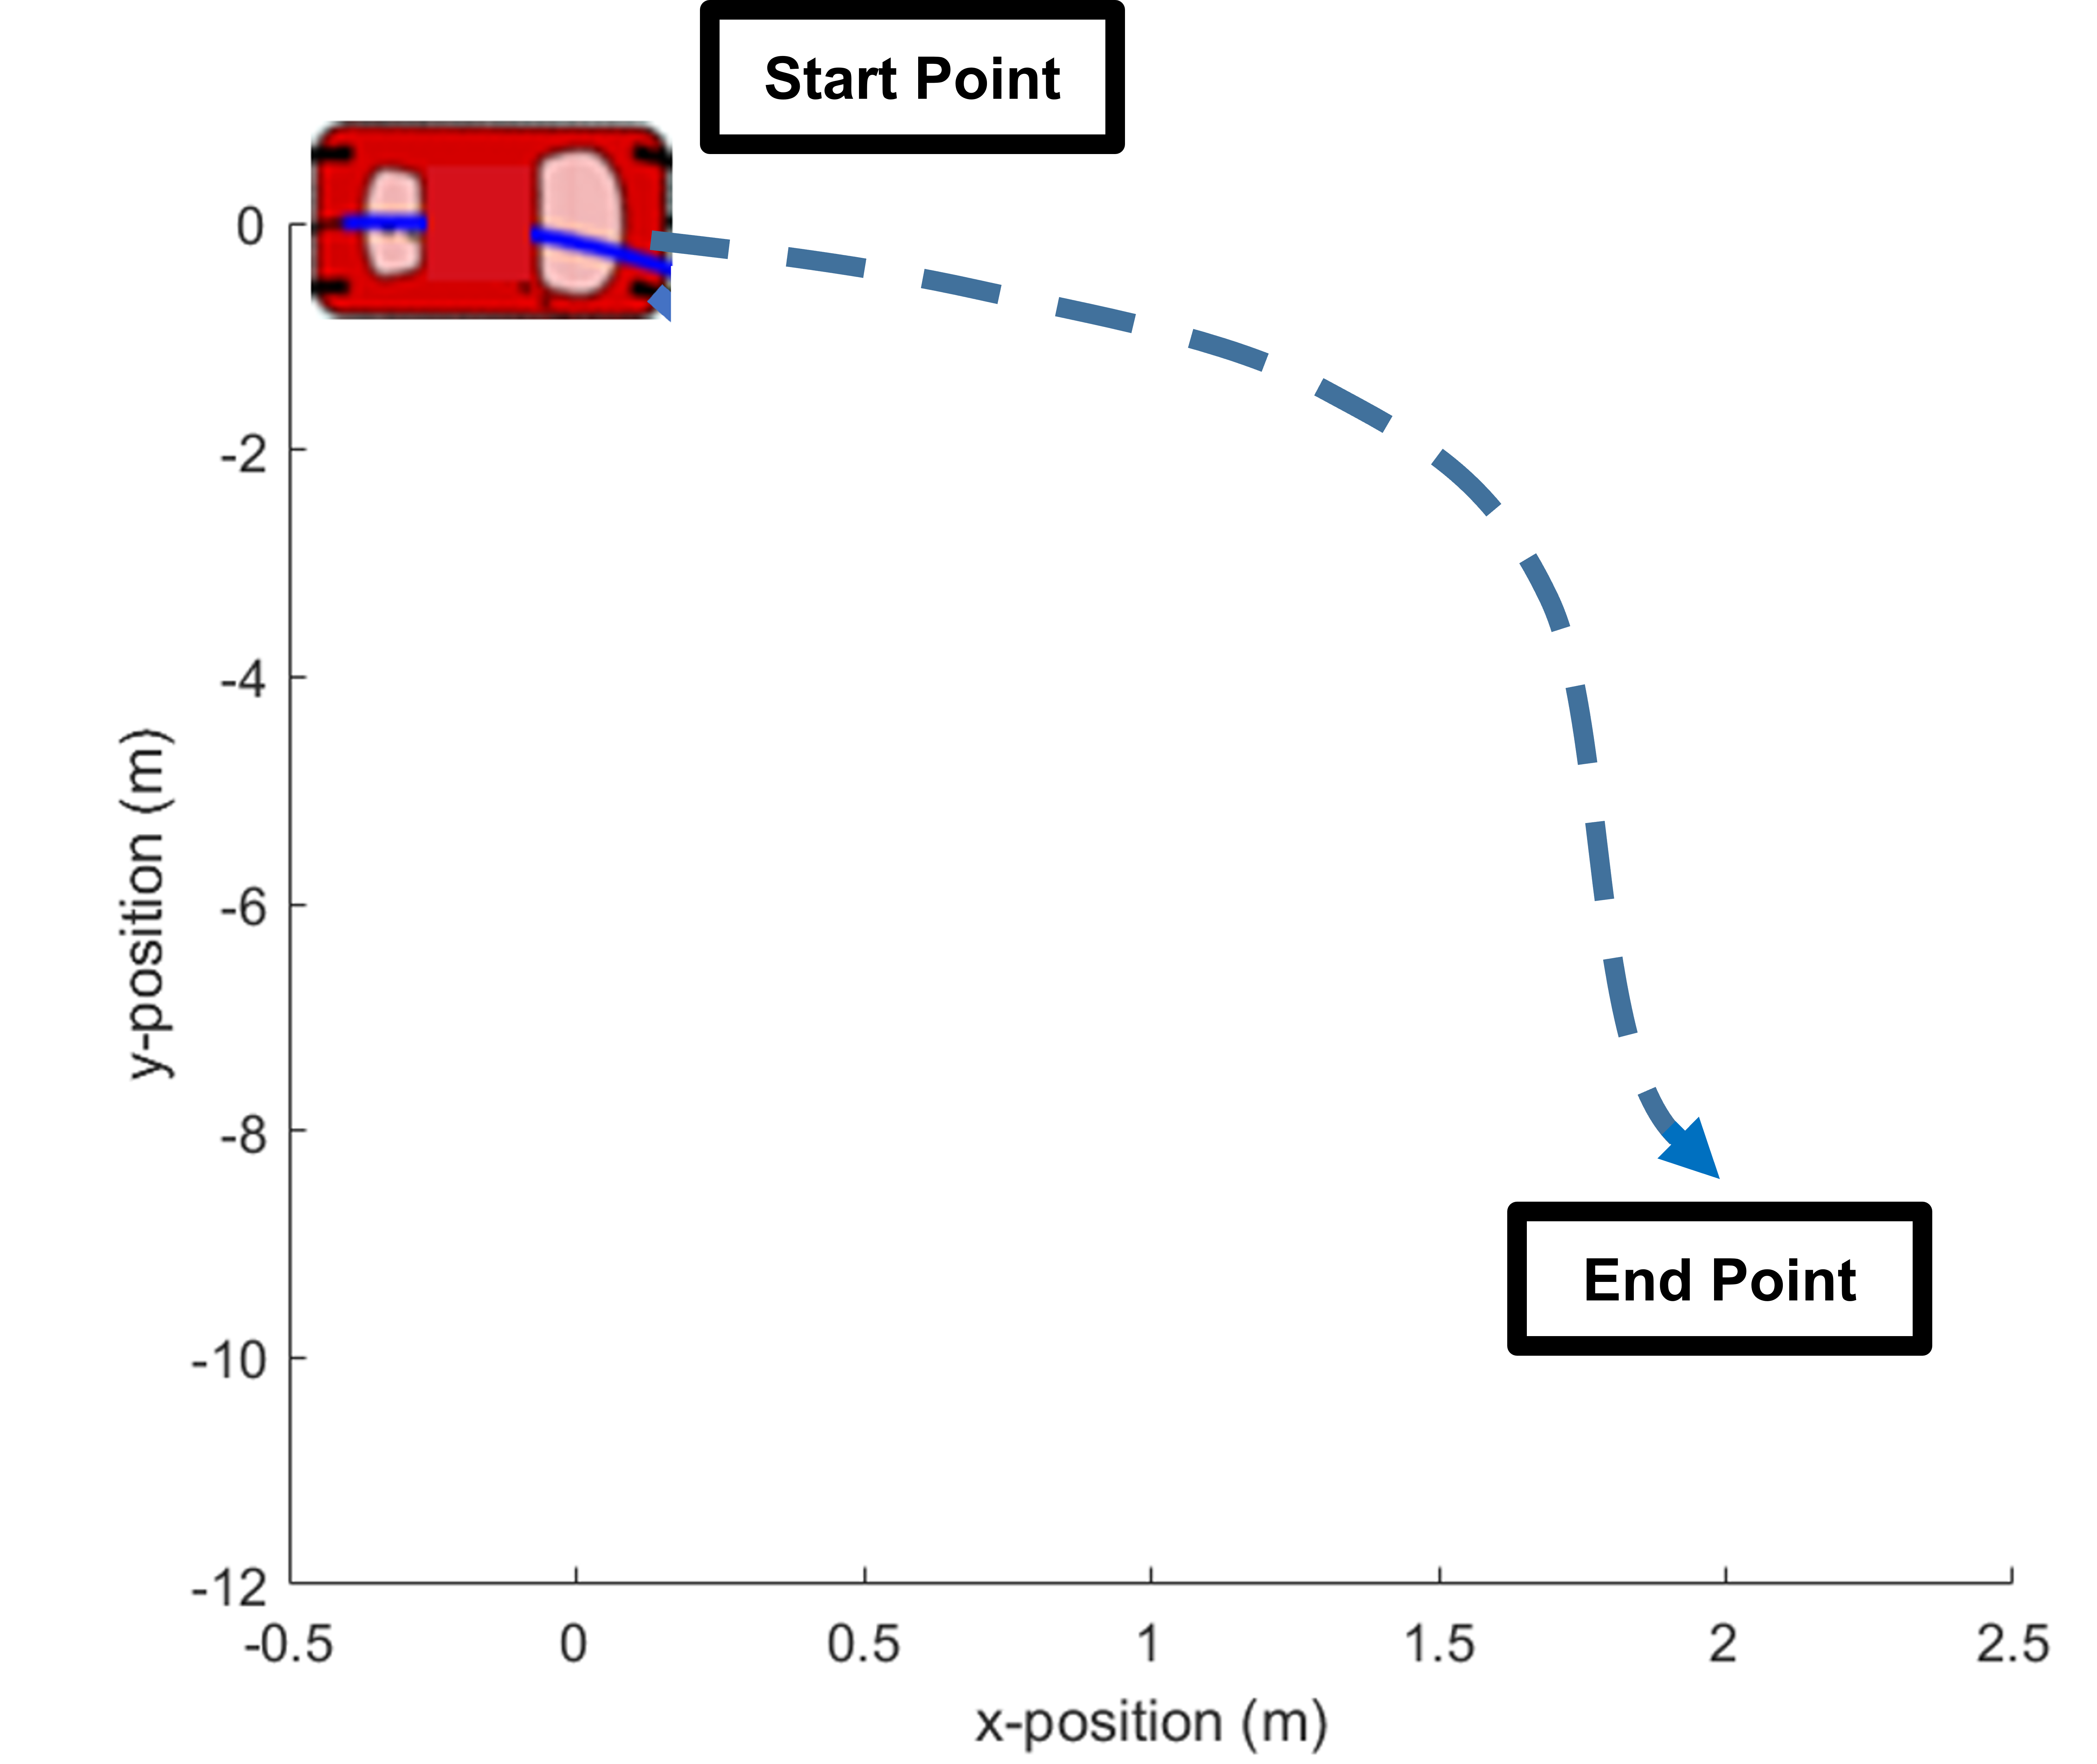
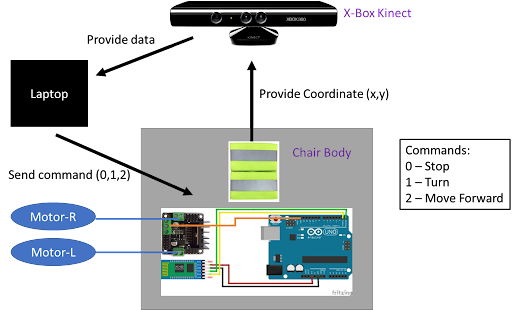
The goal of this project would be to design a robot and maneuver it to a desired end position by sending appropriate control commands, as shown in the figure below:
Robot Design
There are two inputs to the two-wheeled robot - control input to the left motor (Motor-L) and the right motor (Motor-R). We provide control inputs in the form of rpm of the motor to the Arduino ranging from its minimum to its maximum velocity. We then normalize the inputs to a float type number ranging from -1 to 1, where the sign denotes the direction of rotation. Number 0 means the motor is not moving at all.
Data Collection
We don't know the direct relationship between the control inputs of the two motors to the change of distance and orientation, which are two metrics that need to be used for us to make precise control decisions. We can do this by:
- sampling data by running different commands to the robot
- observing the relationship between the inputs and outputs using statistical analysis
Defining the Inputs and Outputs
Since the change in position and orientation of the robot should be recorded for every input command sent for every time step, we have to define a coordinate system for every time step. The change in position and orientation can be illustrated as follows:
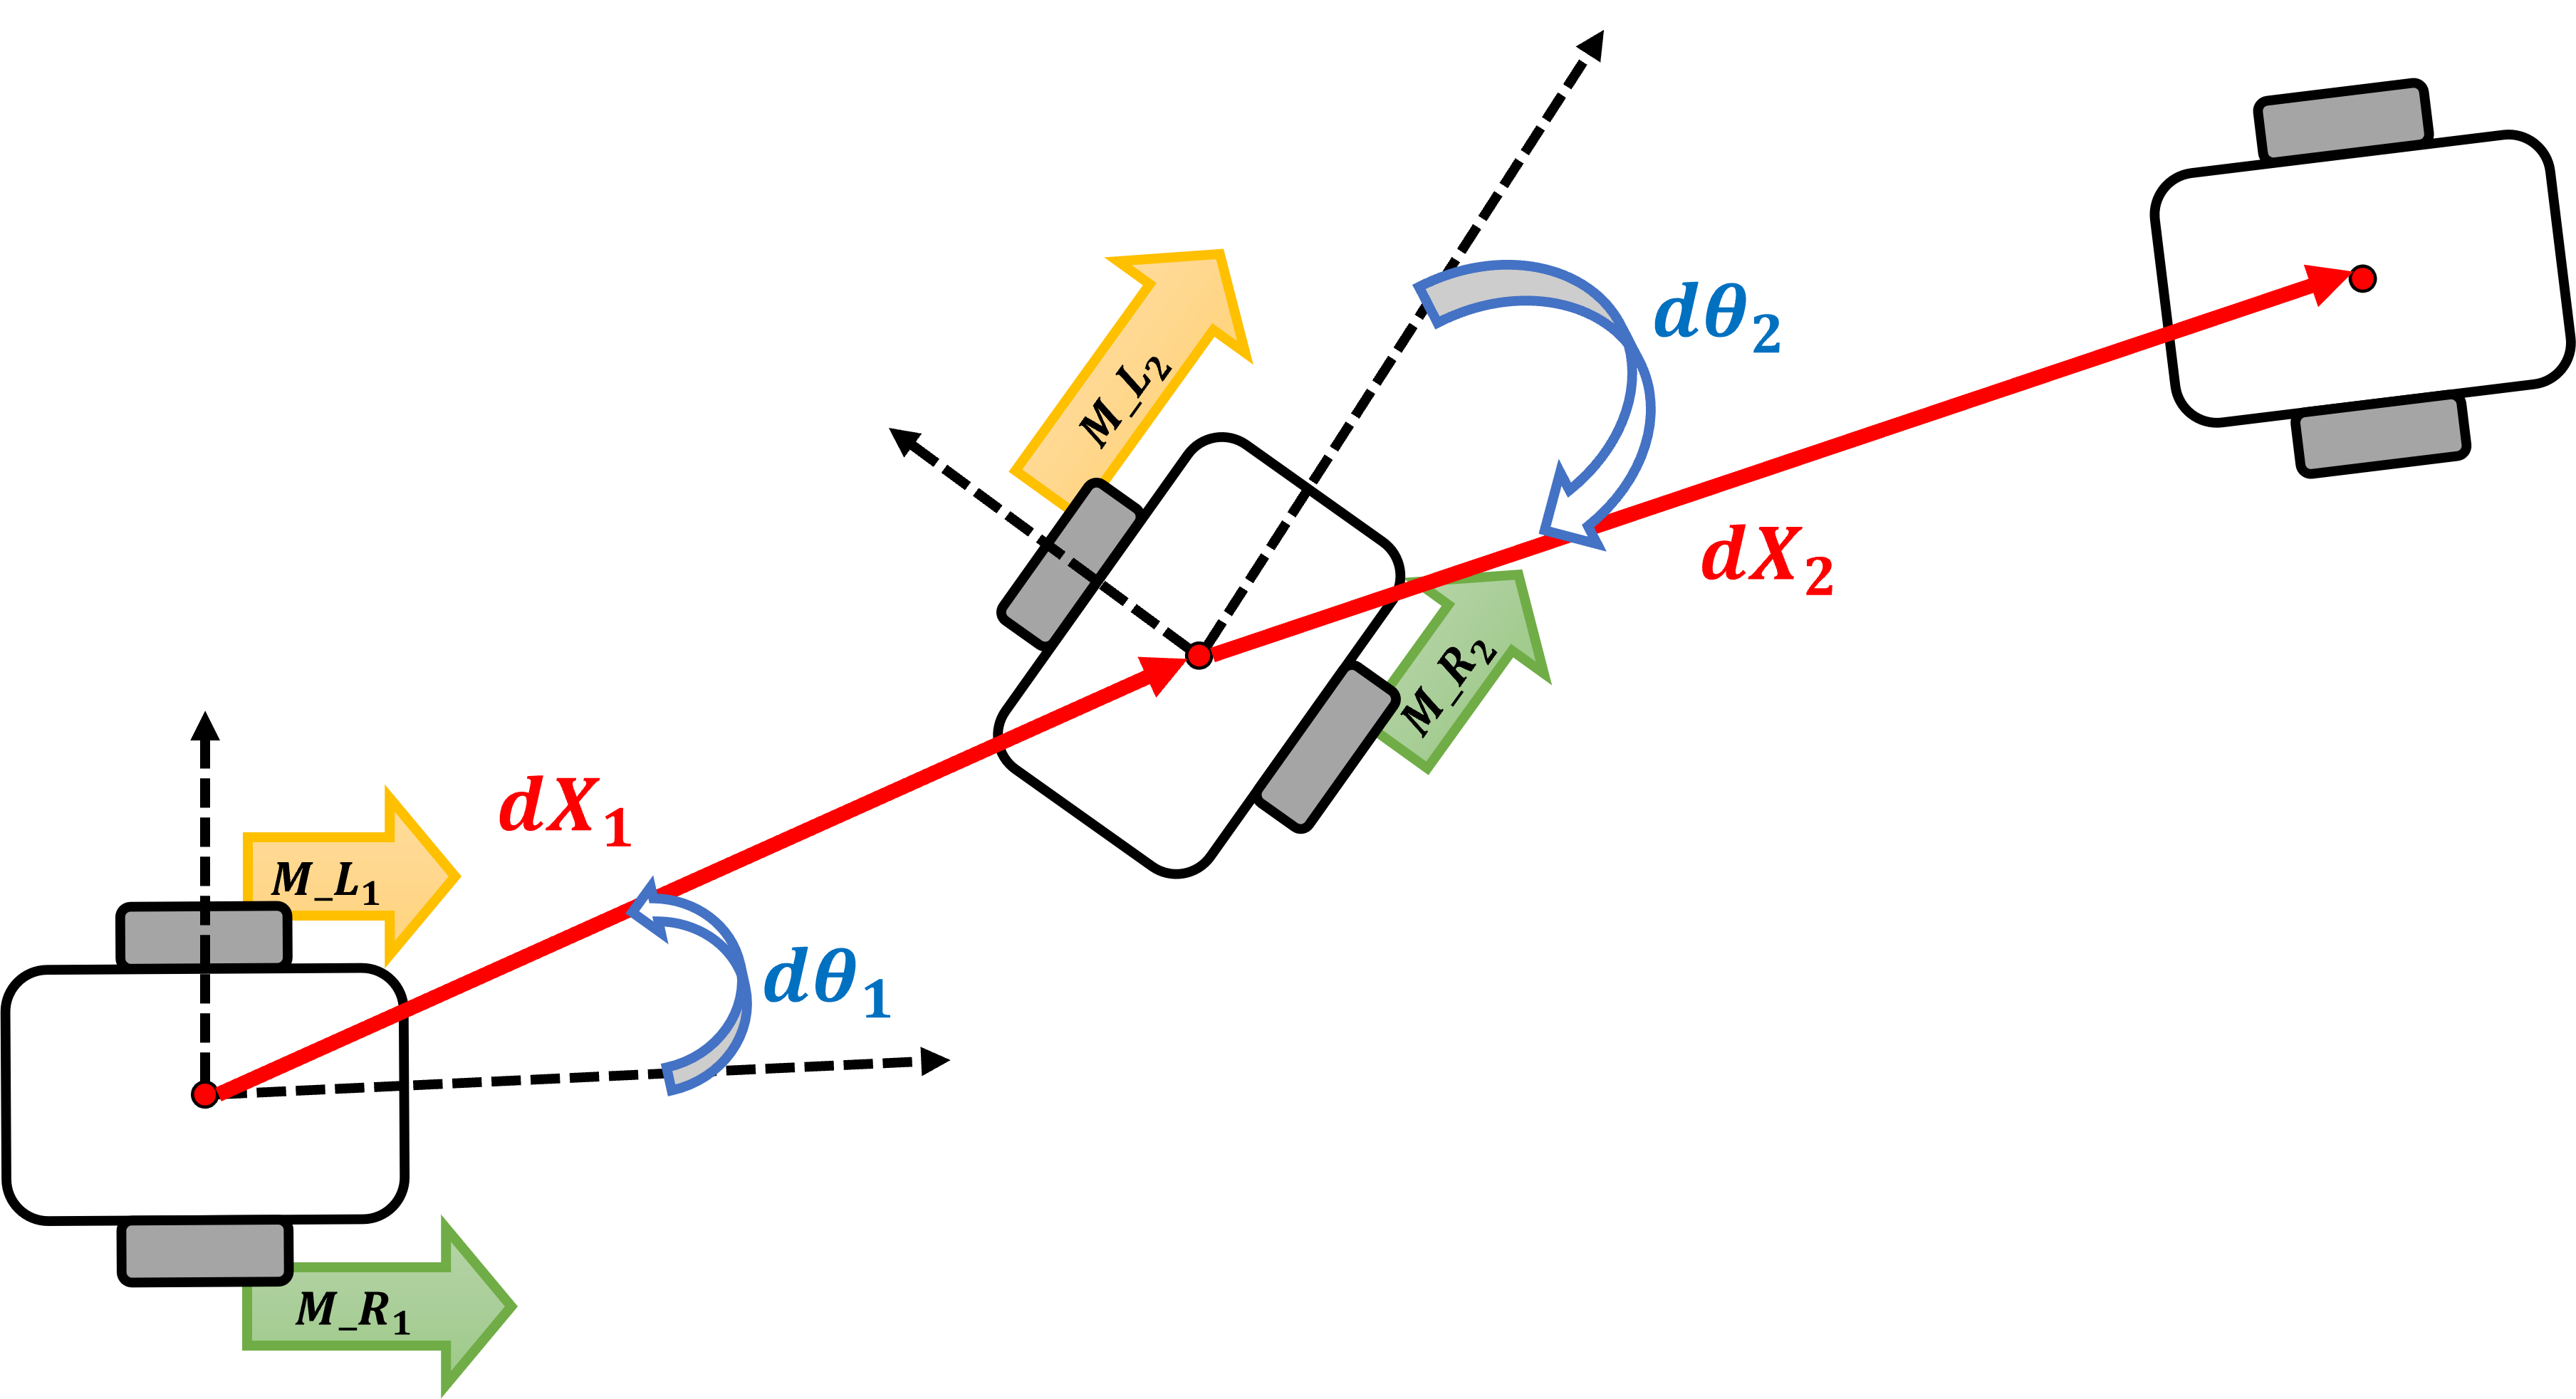
For every set of commands and , there are two outputs - change of distance and change of orientation, denoted as: and The Right-hand rule is used to denote the sign of rotation in degrees. Hence, the rotation is positive counterclockwise and negative clockwise.
Measuring the data in virtual space
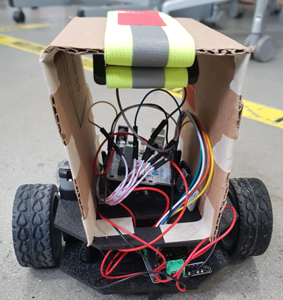
In order to measure the change of distance and orientation of the robot, we monitored the robot’s real-time position by tracking it with Microsoft Kinect, a device used in X-box consoles. The position of the robot is recognized by the Kinect through the infrared rays emitted from the upper side of the robot. The position data is transferred to the computer to calculate the center position and direction of the robot. After a set of input commands are sent to the robot, the Kinect detects the change in the center position and orientation of the robot with respect to the initial position.
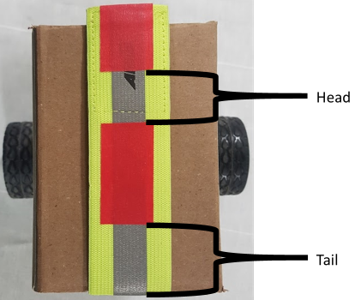
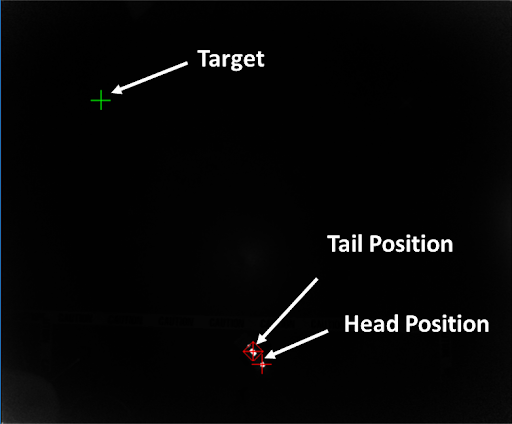
A pad that emits infrared lights was attached to the robot so that it can be detected by the Kinect device. By segmenting the pad into wider and narrower regions, we can assign head and tail properties. Once the Kinect device was installed to the ceiling facing downwards, the tail and head position of the robot could be detected in real time as follows.
Data Preparation
By randomly varying the motor inputs, we can run the experiment and obtain coordinates taken from the Kinect. Following is the dataset obtained (blue denotes the inputs and red denotes the outputs)
| Command | Motor-L (rpm normalized) | Motor-R (rpm normalized) | Position change (dx, dy) | Orientation change (DEG) |
|---|---|---|---|---|
| 1 | + 0.4 | + 0.5 | (0, 0.4) | 10 |
| 2 | + 0.4 | + 0.5 | (0.2, 0.5) | 12 |
| 3 | + 0.4 | + 0.4 | (0.3, 0.6) | 15 |
| ... | ... | ... | ... | ... |
| N | + 0.4 | + 0.4 | (5, 6) | 10 |
Data Analysis
As we have two inputs (Motor-L and Motor-R) and two outputs (Position change and orientation change), we can observe the relationship between the inputs and outputs using a Multivariate linear regression model. We can first use the Least Square equation to see how much the inputs linearly affect the outputs.
From Least Squares Analysis, it was found that:
with R-squared values 0.879 for and 0.730 for
We found that each pair of weights of two inputs for position and orientation change had similar magnitudes. Based on this observation, we can simplify the model by comparing the combination of the inputs to each of the outputs to get more insights about the data. We can combine two inputs as follows, based on their given coefficients.
- Distance ~ f(Motor-L, Motor-R) -> f(Motor-L + Motor-R)
- Orientation ~ f(Motor-L, Motor-R) -> f(Motor-R - Motor-L)
We can then run a simple linear regression model to observe patterns. Below are the results.
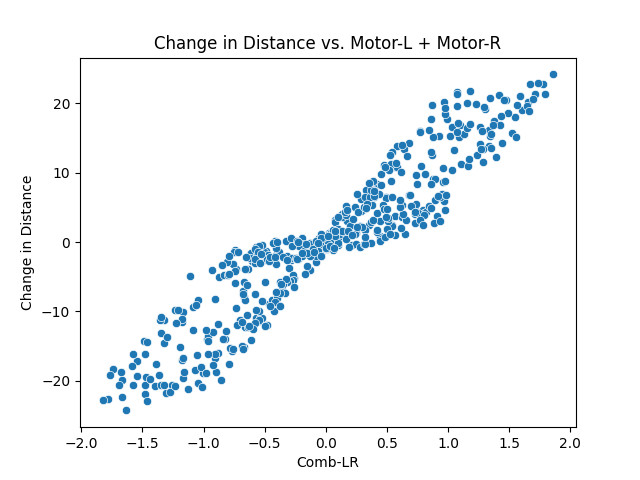
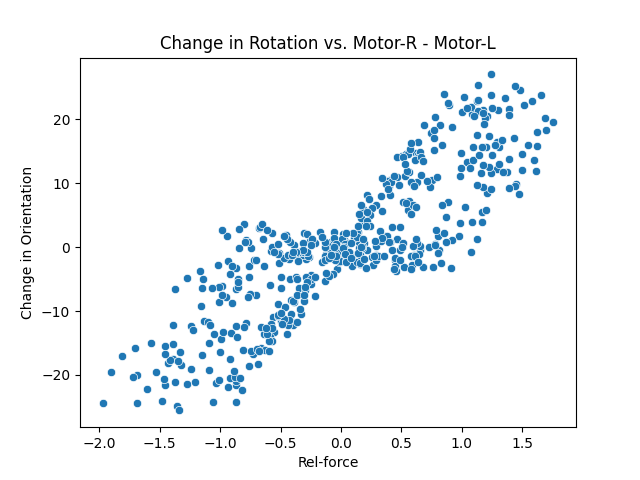
For each of the graphs, a linear relationship with an interesting pattern was observed - the values are closely dispersed near -2, 0, and 2, and widely dispersed near -1 and 1. What could be the cause for this?
Since -1 < Motor-L < 1 and -1 < Motor-R < 1, -2 < Motor-R ± Motor-L < 2. There are only a few combinations that makes Motor-R ± Motor-L equal to -2, 0, and 2 than -1 and 1, as illustrated below:
What combination of (Motor-R ± Motor-L) makes:
| Result | Possible (Motor-R + Motor-L) Combinations | Possible (Motor-R - Motor-L) Combinations |
|---|---|---|
| -2 | -1 and -1 (only combination) | -1 and 1 (only combination) |
| 2 | 1 and 1 (only combination) | 1 and -1 (only combination) |
| 0 | Any pair of numbers with opposing signs (ex: -1 and 1, -0.4 and 0.4) | Any pair of numbers with same signs (ex: -1 and -1, -0.5 and -0.5) |
There is a pattern here: for numbers -2 and 2, there exists one solution for each and for 0, motor inputs must be the same in magnitudes.
- -1: 0 and -1, -0.5 and -0.5
On the other hand, for values -1 and 1, there exist numerous combinations where “the directions are the same but the magnitudes are different”. -1 and 1 are the points where the “difference between the magnitudes of the inputs is maximized”. In other words, Case 1 are cases where: magnitudes of the inputs is minimized (= 0) And Case 2 are cases where: magnitudes of the inputs is maximized (=1) We would want to find out whether this observation is true: We can do this by:
- Assigning categorical values to the dataset according to where its discrete values lead. For our case it would be: abs(Motor-R) - abs(Motor-L), where -1 < Motor-R < 1, -1 < Motor-L < 1
- After assigning the categorical values to the motor, we can differentiate them using legends.
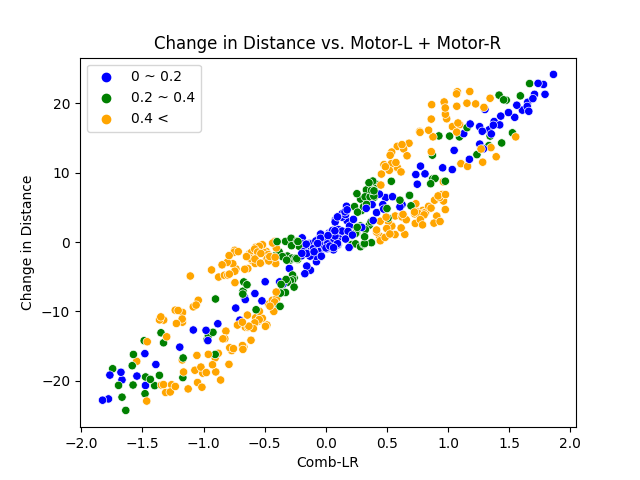
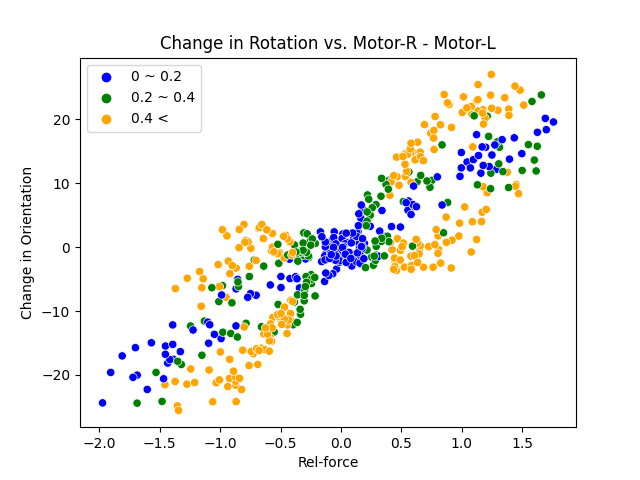
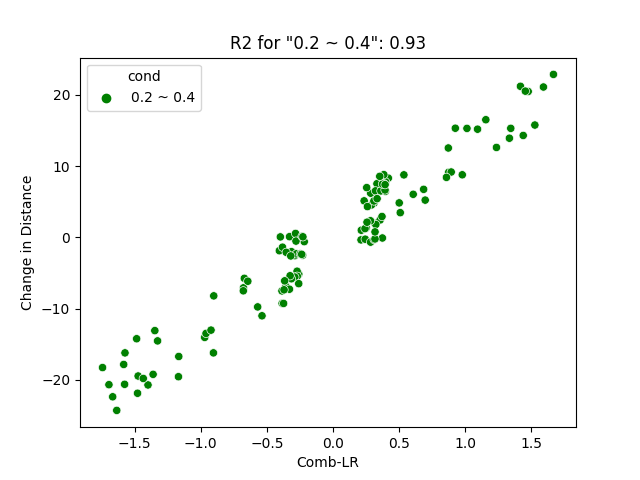
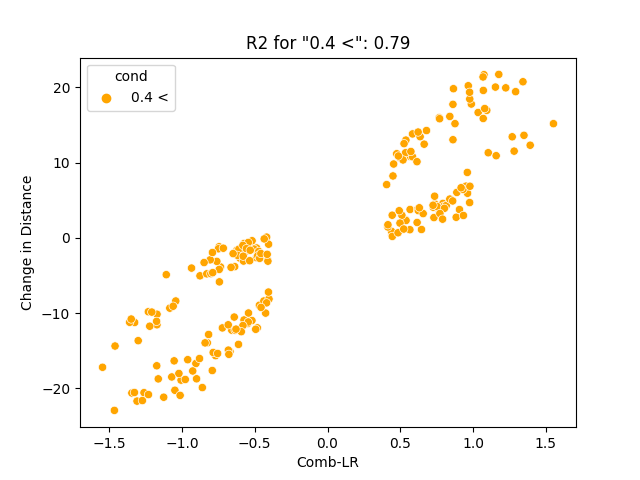
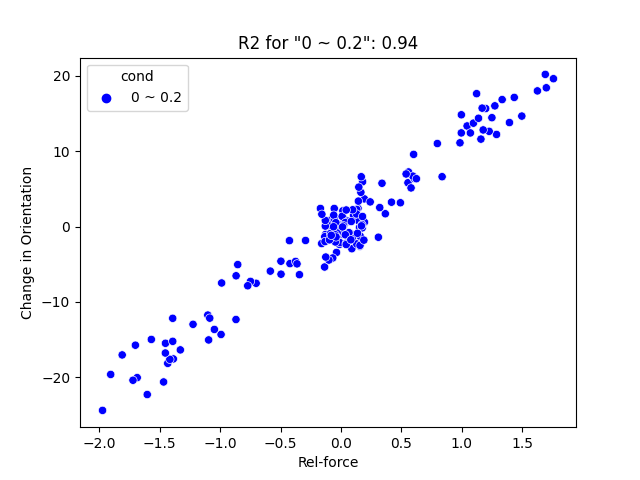
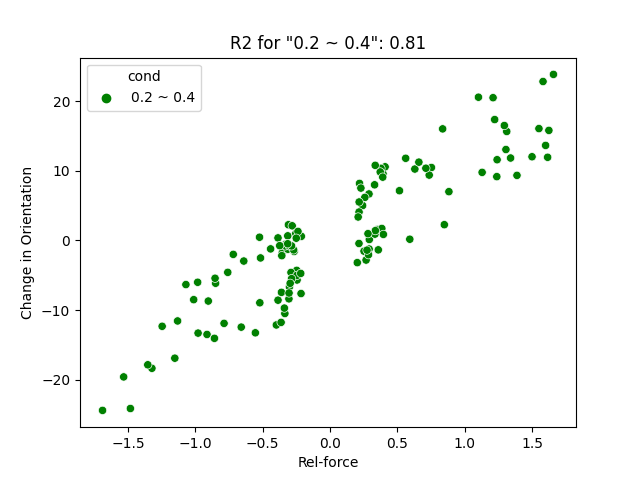
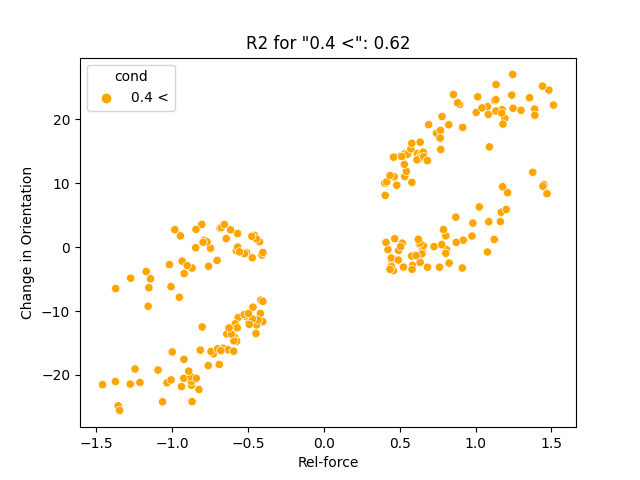
Abs(Motor-R) - Abs(Motor-L) = (Left: 0~0.2, Middle: 0.2~0.4, Right: > 0.4)
Here are two main observations:
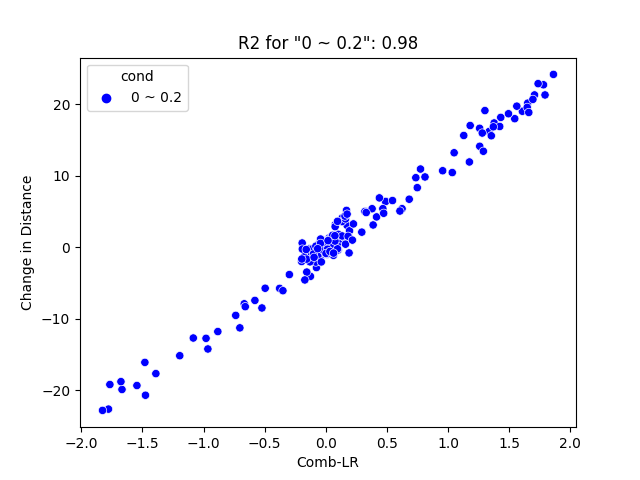
- There is a high percentage of data near 0 for a low magnitude difference in two inputs for both position and orientation change.
- There is a higher coefficient of determination (or r-squared) for the dataset with lower difference in magnitude.
Source of variation (Random Error)
- Friction caused when body of the robot rotates
- Non-homogeneous environment : Altitude of the floor can be higher at certain area of the environment during data collection
- Varying battery life span: as time goes on, the amount of power the battery generates may decrease
- Hardware malfunctioning
Data with a high difference in input magnitude is concentrated near -1 and 1. This is where the friction caused in the rotating body of the robot gets maximized. Also, there was a higher variance overall in measuring orientation than in measuring distance traveled. This could be due to the fact that rotation measurement is more sensitive to such sources of variation.
Choosing an optimal high-level control heuristics based on our observation:
We needed a model that had a strong predictive power as we wanted our control input to make precise control decisions. From data analysis, we can infer that if we minimize abs(Motor-R) - abs(Motor-L), which is zero, standard deviation decreases, generating a more precise control decision. There are four combination of motor inputs that produces four different types of movements:
- Motor-L (positive) & Motor-R (positive): move forward
- Motor-L (positive) & Motor-R (negative): rotate clockwise
- Motor-L (negative) & Motor-R (positive): rotate counterclockwise
- Motor-L (negative) & Motor-R (negative): move backward
By determining the weights of the variables, we can provide a control signal that can precisely control the robot to the desired position and orientation. Below is an illustration of how the robot would behave when given a desired degree of orientation and desired end position.
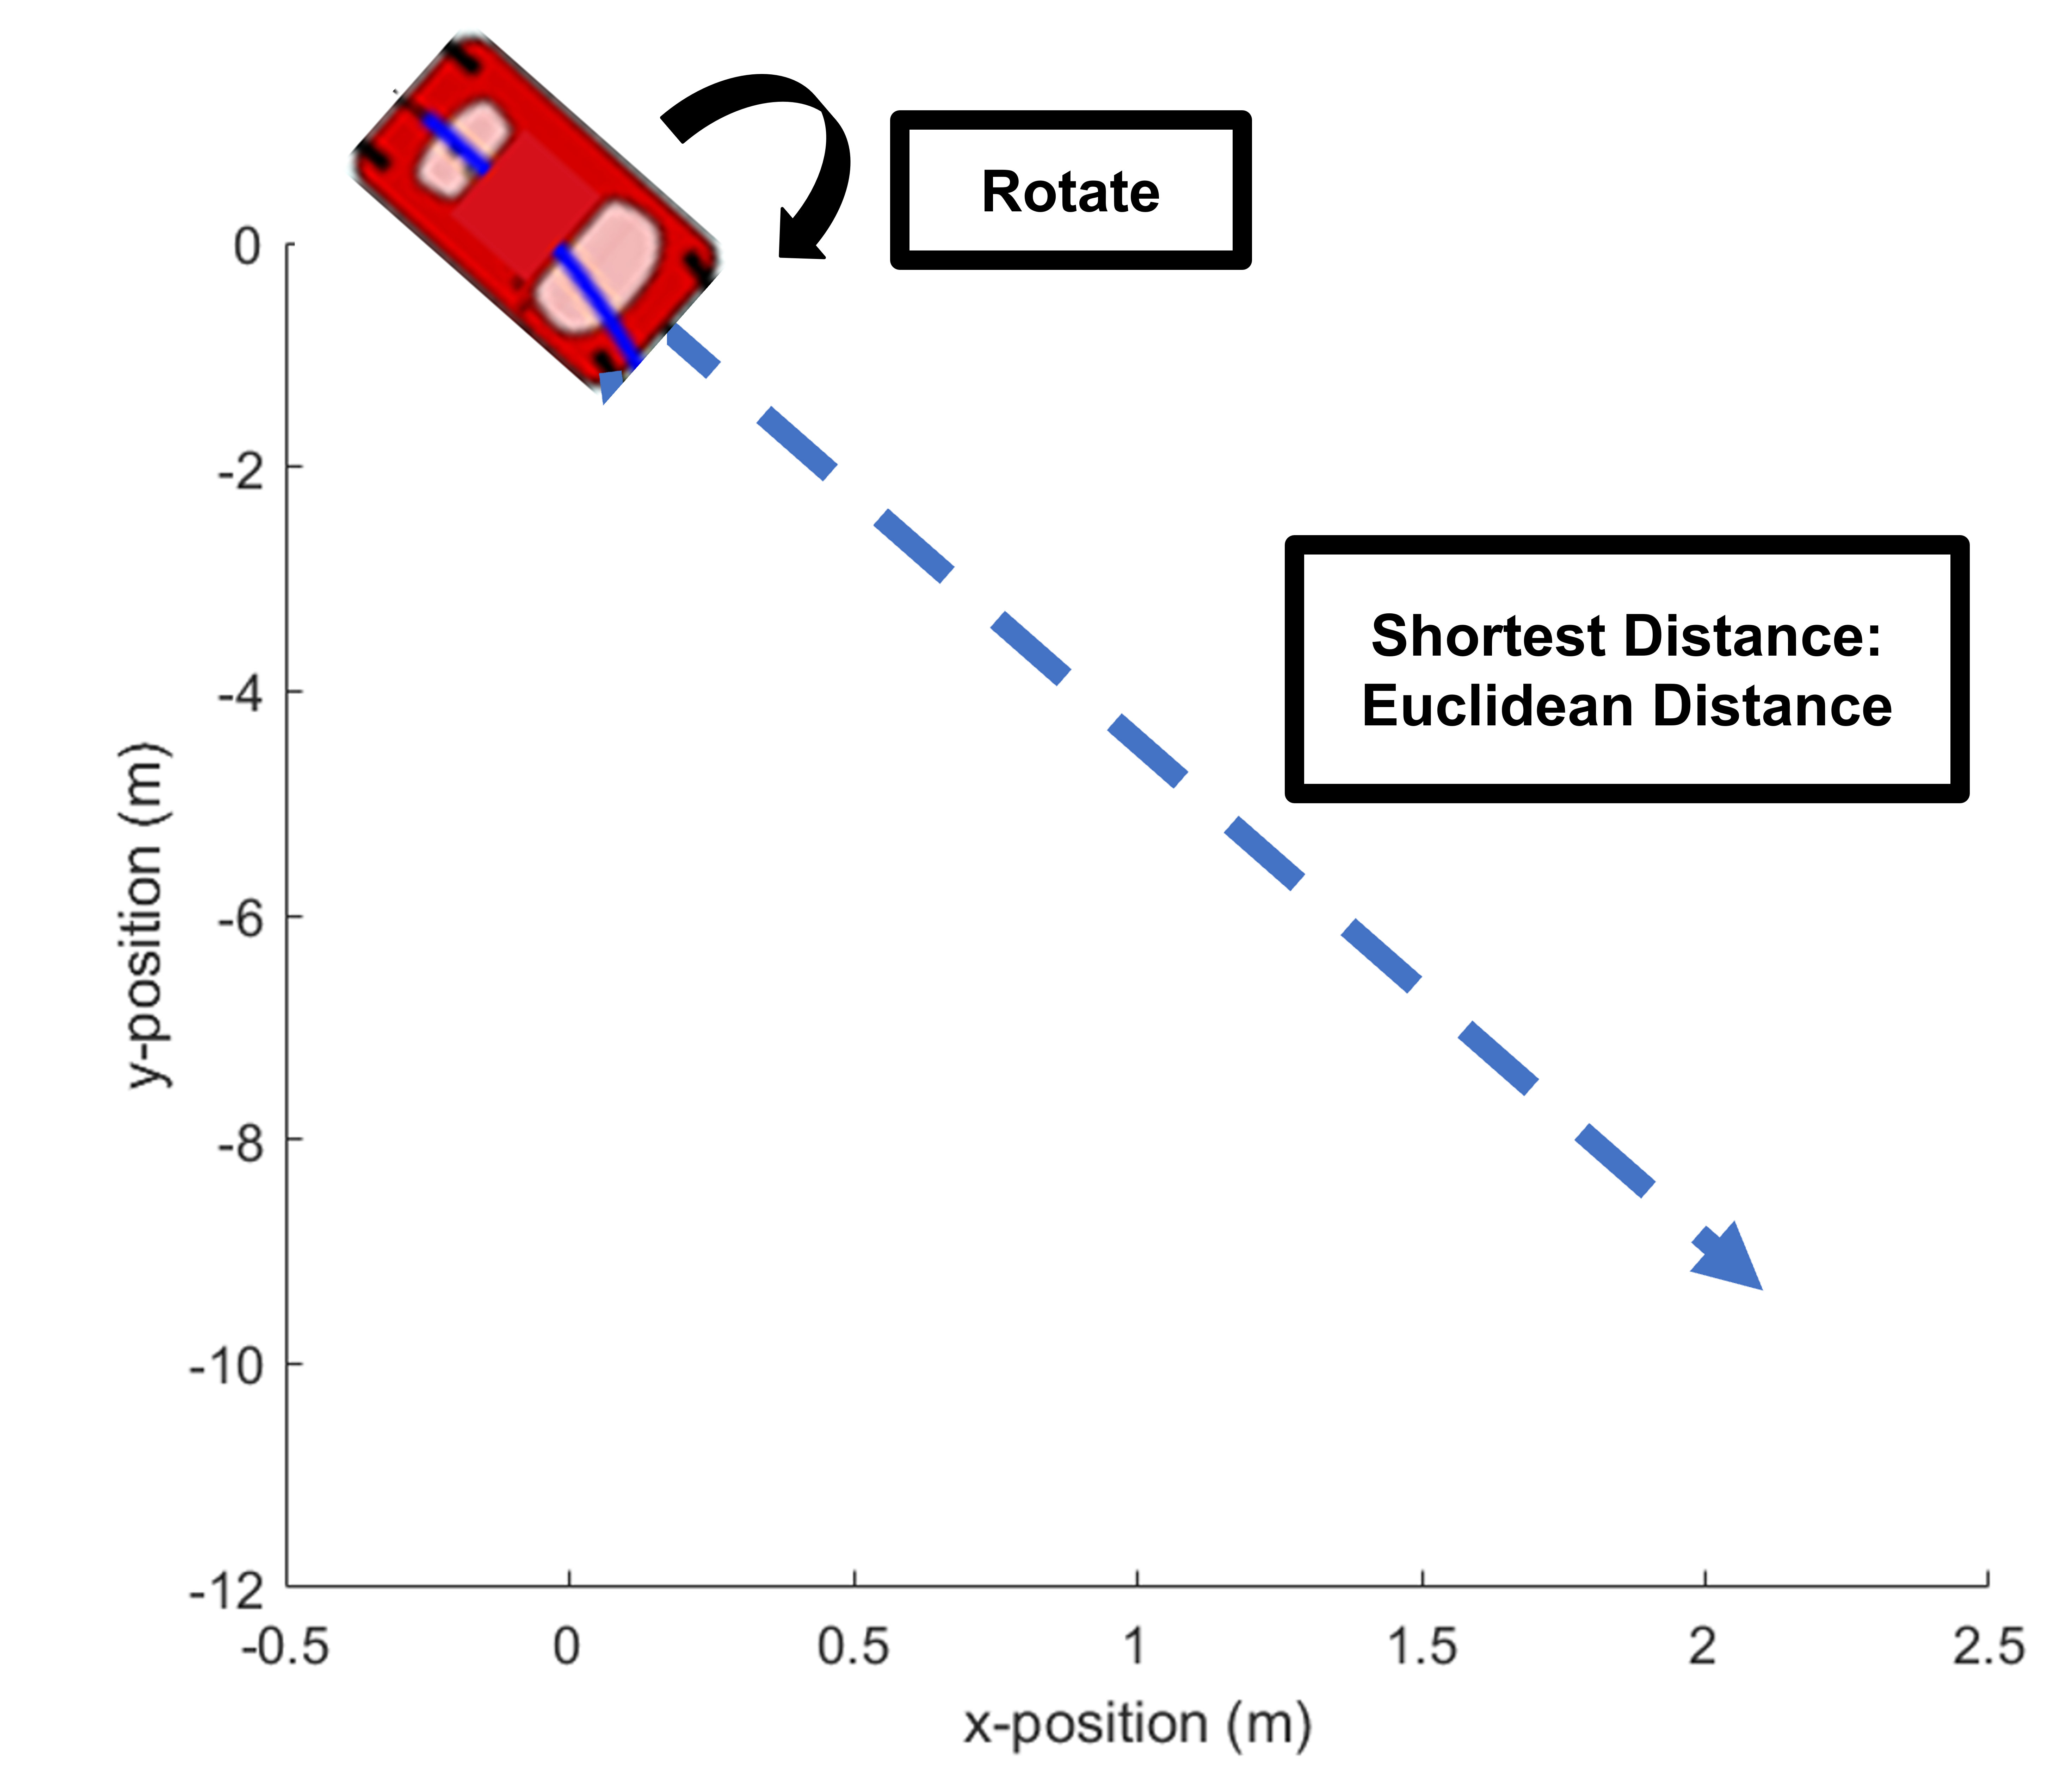
Using the results obtained from linear regression, we can use these coefficients to control the robot to move and rotate to a desired amount.
We can pick a combination of angular velocity and time elapsed, which will result in y or theta, then set a time that will result in the desired distance or rotation angle. The only difference would be the speed at which the robot will travel or rotate.
Case 1: Commands in the physical world
When we want to make commands such as “rotate 270 degrees clockwise, then move 3 feet forward”, we have to take the systematic error in the results into account. The measured values of the distance traveled and the angle of rotation is not the same as the ground truth values measured in real life. This is due to the low resolution of the measuring device - when the device detects the robot and estimates its position, the measurement consistently differs from the true value proportionally or by an offset.
We can address this problem by calibrating the results obtained from the “calculated” values to ground truth values.
Below is a demonstration of sending commands to the robot to rotate 270 degrees clockwise, then move a certain distance far enough to not fall off the table.
Case 2: Commands in the virtual world
We can assign the desired position in the virtual environment created with Kinect. Here we define the desired position in the virtual world by clicking a coordinate point with a mouse. The PC then calculates how much time the motor of the robot should run. The robot then does a series of rotations and moves forward until the distance between its center and the desired position falls within an acceptable tolerance range. We don’t need to take systematic error into account here because the commands given are in the same environment as where the data was collected.
Below is a demonstration of how the robot performs when assigned a desired position. It can be seen that the robot navigates well with precise control signals.
Sponsored by:
NetDragon, an online game and education company in China, is conducting online and mobile education projects using VR and other technologies. Receiving financial support from the headquarters, we collaborated with students at Beijing Normal University to design a high-tech educational classroom environment.